

In biology, and other scientific fields, it is vital to obtain quantitative data, and these data must be true. Non-bias data are essential in science. Bias means the alteration of the real data due to the experimental process: sample selection, sample processing, staining or detection of the elements to be studied, data calculation methods, and so on. Stereology is a set of experimental methods designed to estimate area, volume, length and number in tridimensional samples, without bias. These methods are performed in sections obtained from the samples. In this way, it is possible to estimate the total number of neurons in the brain, the volume of a tumor, the surface of the respiratory alveoli, or the length of a capillary net of an organ. Following the sterological method, there is no bias in the final value of the estimated data.
Stereology is based on a design of the experimental procedure made before the first cut is done. This design has no previous assumption about the sample to be quantified. That is, the procedure can be applied to whatever tridimensional object, without knowing nothing about it in advance. Thus, it is independent on the size and shape of the object. If the design is correct, a non-bias quantitative estimation is obtained. It is an efficient method to get quantitative data. The sampling is systematic and random, that is, all elements of interest have the same probability to be counted.
A main tool in stereology is the probe. A probe is a template containing geometrical drawings that interact with the item of interest in the sections. Each interaction, or event, of a geometrical form with an item is translated in a quantitative value: number, area or volume.
Volume
The volume of an object has been traditionally calculated by plunging the object in water and measuring the displaced water volume. However, this method does not work for hollow structures or for objects that are located within other larger structures. The volume can be also estimated by calculating the volume of the most closely geometric form to our object, such as a sphere, an ellipse, a square, a pyramid, and so on. In this case, the estimated volume is more or less "real" depending on how similar is the object form compared to a geometric form. In stereology, the method to estimate the volume of tridimensional objects uses sections obtained from the object, no matter the shape, size, and inner cavities, was described by Cavallieri in 1635. The Cavallieri's method consists in getting uniform, parallel, and random sections from the object, and it is based on the idea that every object can be represented by infinitive and consecutive sections. There is no need for previous assumptions, that is, it can be applied to whatever tridimensional object we want to measure, and it is independent on the shape and inner cavities.
Let's say we want to estimate the volume of an irregular organ, as it is shown in figure 1. It contains two inner cavities (not shown in figure 1) and the data will be obtained from 10 µm thick parffin sections. We have to keep in mind that the procedure may affect the initial volume of the organ. For example, paraffin embedding may produce retractions of tissues so that the total volume is reduced. This is very important when estimating the final volume so that we need to know the retraction percentage between the initial state of the organ and the final one. Anyway, imagine there is no retraction or that we know the reduction of the volume caused by the procedure.

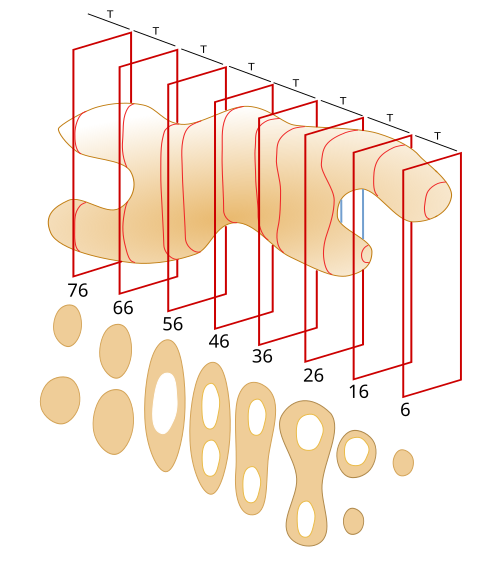
The first thing to do is to select a random orientation of the sample relative to the blade edge, that is, the orientation of the cutting plane has to be random. Once the orientation of the sample is selected, we can establish a virtual axis perpendicular to the cutting plane (to the sections) that goes through the sample (Figure 2). Then, the sample is divided in 8 segments following the virtual axis, being the segments equal in lengths. Each of these segments are known as an interval (T).

The next step consists in choosing a random number in the T1 interval. For example, if T1 is 100 µm long, a number between 1 a 100 is randomly selected, and then the object is cut with a blade placed at this random position and perpendicularly to the virtual axis. If the object has been previously sectioned in 10 µm consecutive thick sections, T1 contains 10 sections, and a random section has to be selected between 1 and 10. Let's say the random number is 6. Then, the 6th section is chosen (Figure 3). After that, another section, or another cutting plane, at a distance equal to T (100 µm) from the first selected section is selected in T2. That is, the 16th section, or a cutting plane at a distance of 160 µm from the beginning of the object.

In this way, once the first section is randomly selected in the first interval (T1), the second section to be chosen is found at a distance from the first section that is equal to the interval length (T: 100 µm or ten sections), and the third section is separated 2*T from the first section, and so on until a section is selected in each of the 8 segments (Figures 4 and 5).

When the section profiles are obtained (Figure 5), the area of each section is estimated, without the cavities. The point grid method is used to estimate the area. It consists of a grid template where each line-cross is a point. Each point is associated with a known area (Figure 6). The template is ramdonly rotated and overlapped with each section profile. The points that hit the tissue, but not those over empty spaces, are counted. The density of the grid is adjusted to get about 200 hundred counted points from the eight sections.
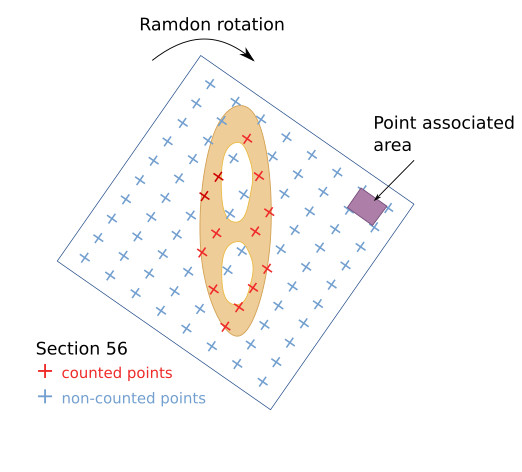
The estimated area of a section is the number of points hitting the section (∑p) mulitplied by the point associated area (a(p)). In the example of figure 6, Area56=13p*a(p). .
For each section: Ai=∑p*a(p)
Ai = area of section i; ∑p = number of counted points; a(p) = point associated area.
The volume (V1) between the first two selected sections (6 and 16) is estimated by multiplying the area of section 6 (A6) by the length of the interval 1 (T1).
V1=A6*T1
V1 = volume between se sections 6 and 16; A6 = area of section 6; T1 = length between the sections 6 and 16.
The total estimated volume of the object, or reference volume (V ref), results from the sum of the estimated volumes between each selected sections, multiplied by T. Vref=A6*T1 + A16*T2 + A26*T3 + ... Since all the intervals are equal in length:
Vref=∑At*T
Vref = reference volume or total estimated volume; ∑At = the sum of the areas of all selected sections; T = interval, length between sections.
Regarding the units, the point associated are is usually in micrometers squared (µm2), the number of points has no unit, and T is the distance in micrometers (µm). All these results in volume units: micrometers cubed (µm3).
-
Bibliografía ↷
-
Mouton PR. (2002). Principles and practice of unbiased stereology. An introuduction for bioscentists. The John Hopkins University Press. London.
Stereology Information Center. https://www.stereology.info/
-